
Lab-Tips: Bacteriology
How to do the analysis
Below, I will walk you through how to complete the first analysis: before vs. after soap.
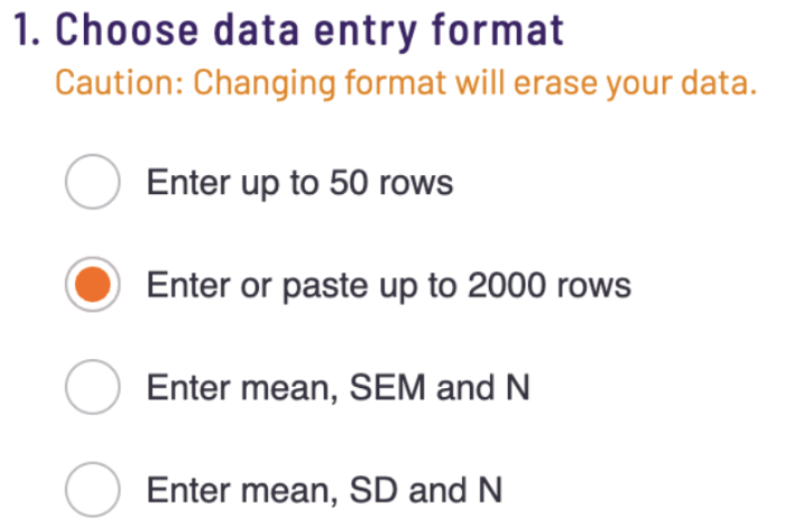
Step 1. Open the t-test calculator. Select "Copy and paste up to 2000 rows" function.
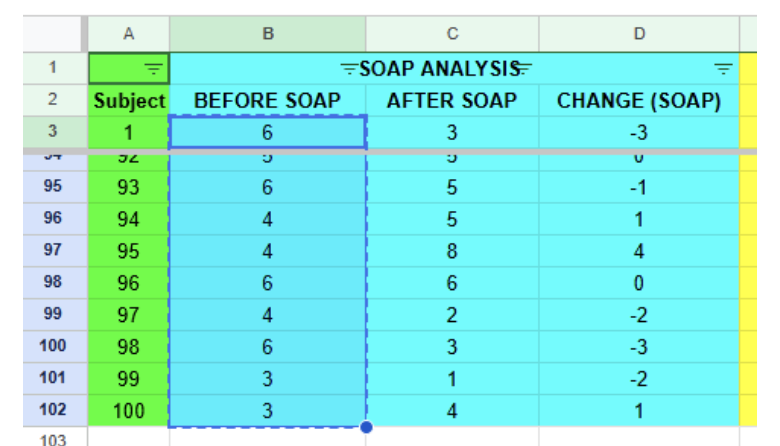
Step 2. Open the dataset. Copy the numbers under the Before Soap column. It should look something like this. Note the highlighted cells have a dotted line around them.
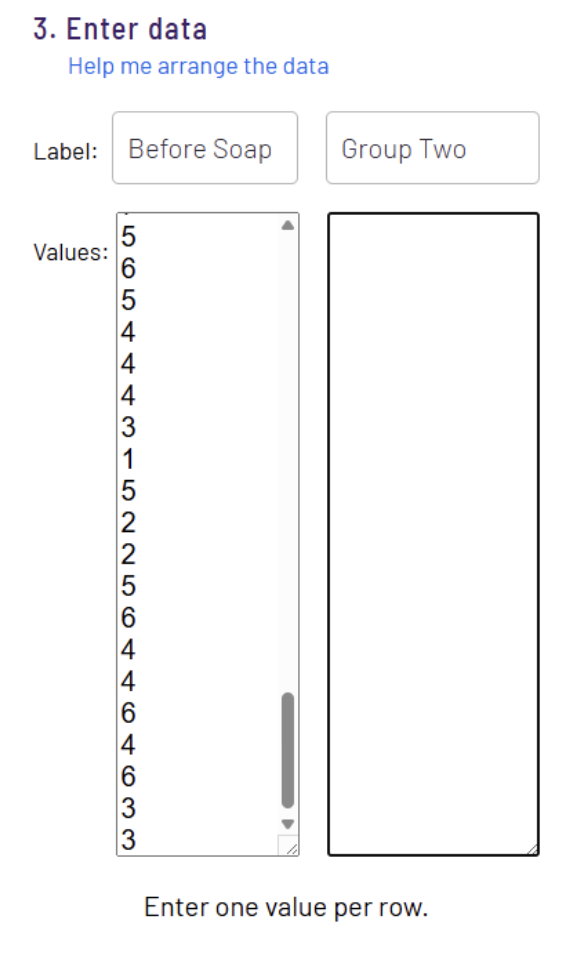
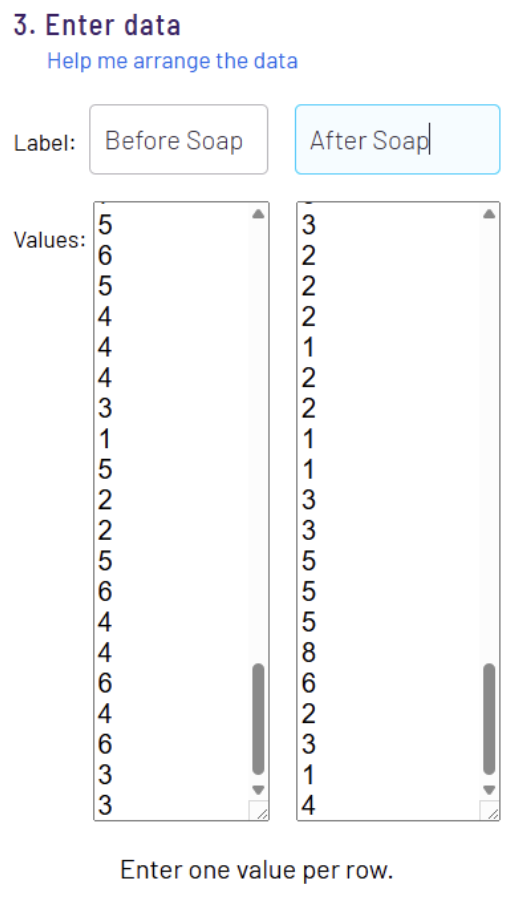
Step 3. Open the t-test. Label the left column 'Before Soap'. Paste the numbers into the t-test.
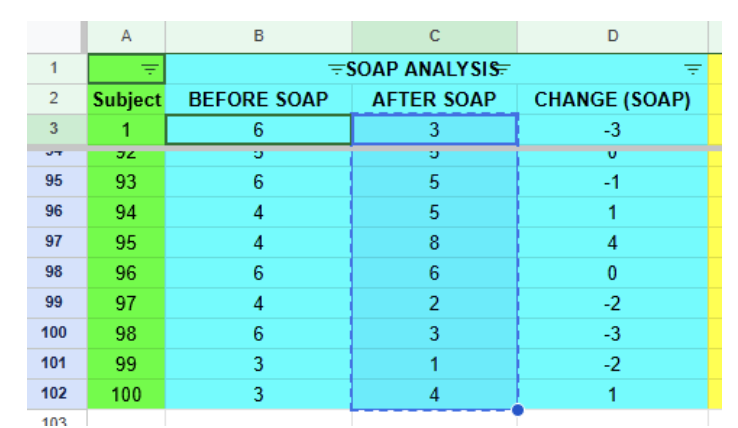
Step 4. Repeat the same procedure for the 'After Soap' data.
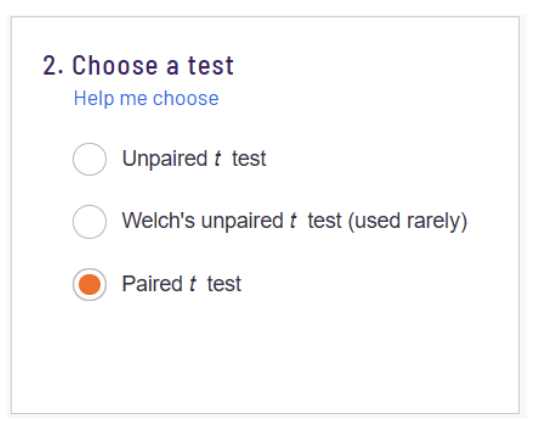
Step 5. In the t-test calculator, select "Paired t test", and push the "Calculate Now" button.
Step 6. Get your results. Note the p-value and means for "Before Soap" and "After Soap". These are the values you will need to report on your graph and discuss in your analysis and conclusions.
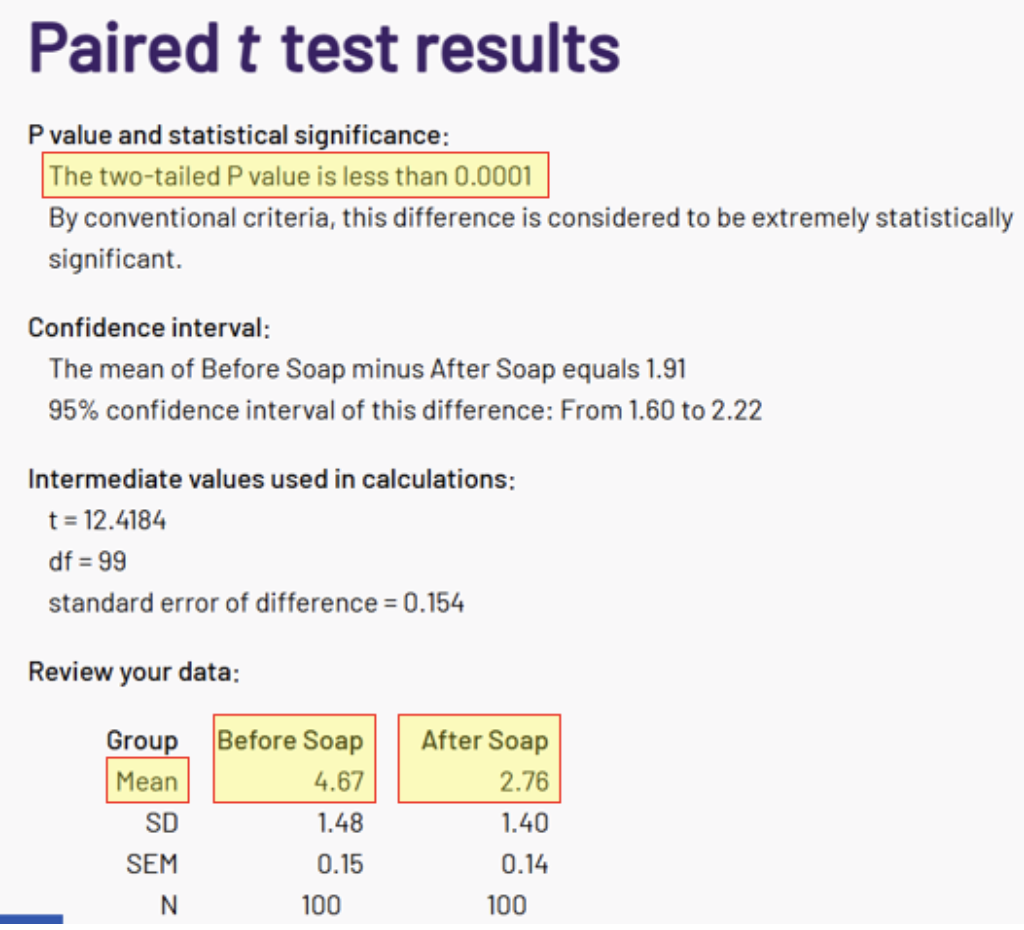
These statistics you will report in the lab manual for the “All Colors” graph. Use this same procedure to complete the remainder of the analyses in the lab.