
Lab Instructions: Introduction to the Scientific Method
Step 1. Get your lab.
Modules > Scientific Method > Lab Download: Introduction to the Scientific Method

Step 2. Gather materials
At least one other person
A bag of Skittles
A blindfold (anything will work really)
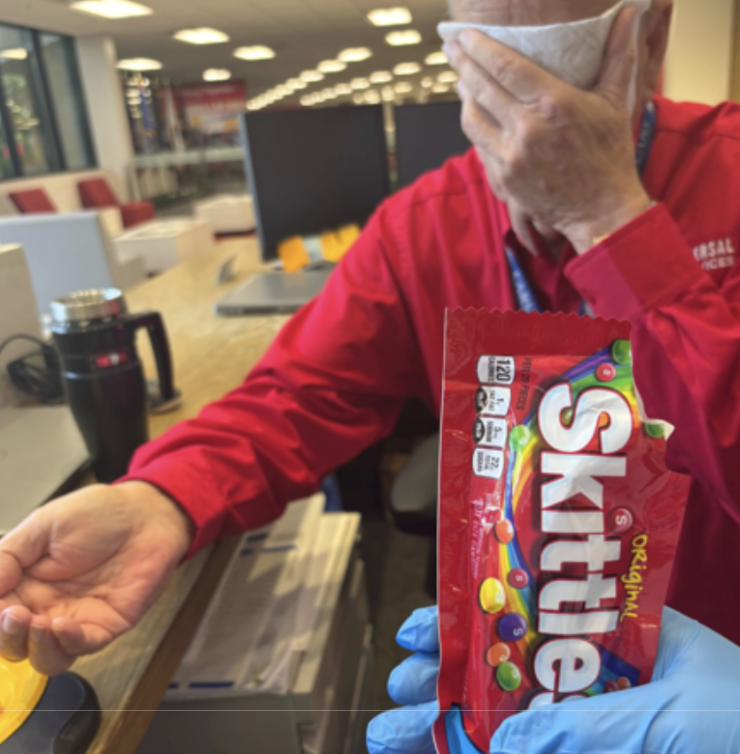
Step 3. Photograph your setup
You must include a photo of your experimental setup for credit. Submit it with your lab.It should look something like this.
Step 4. Run the experiment.
Follow the protocol carefully.
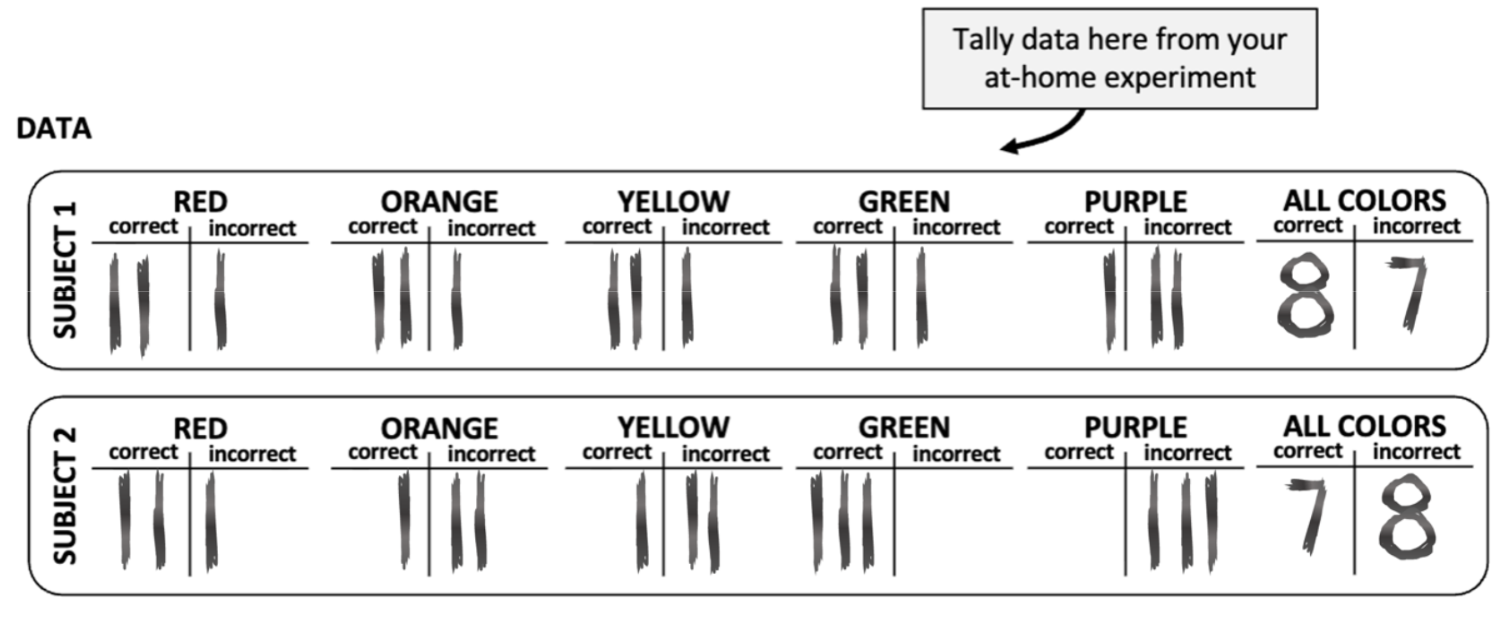
Step 5. Record your results
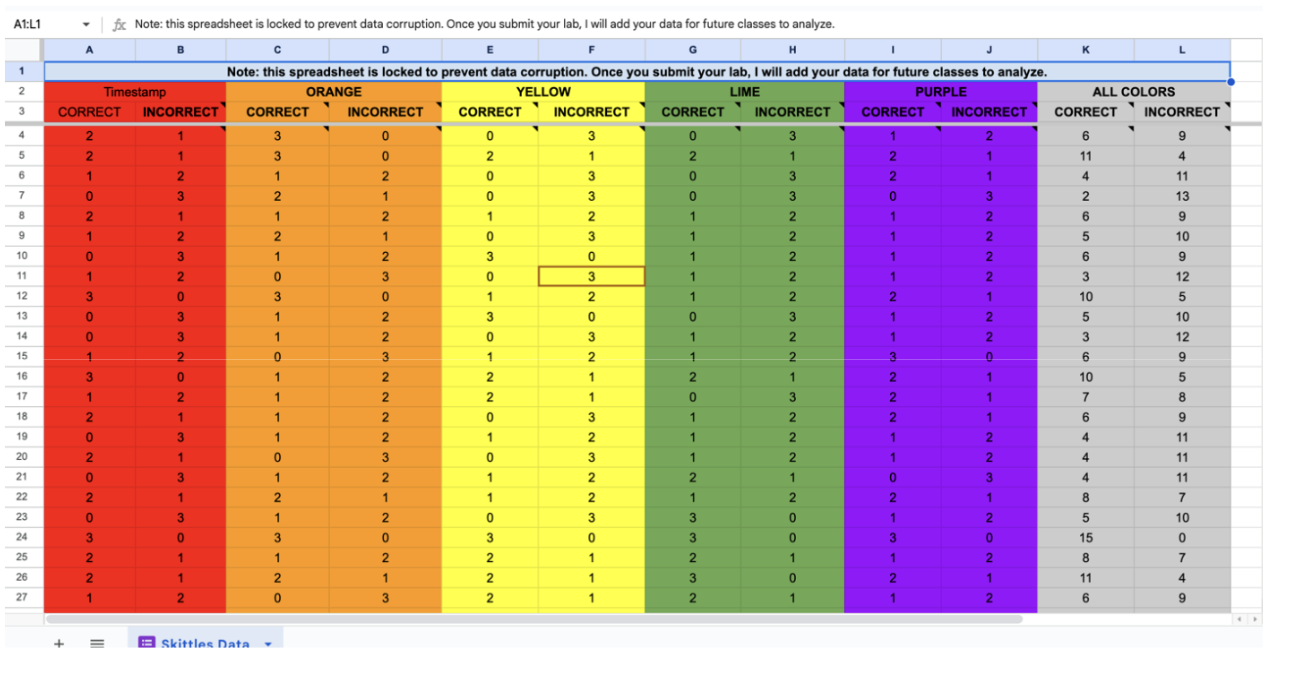
Write your data on your lab page. I will add your data to the class spreadsheet (to prevent corruption, only I have editing access). When you finish adding your data to the data sheet, it should look something like this.
Step 6. Run a t-test
Modules > Scientific Method > Lab Download: Scientific Method
Use the link in the module:

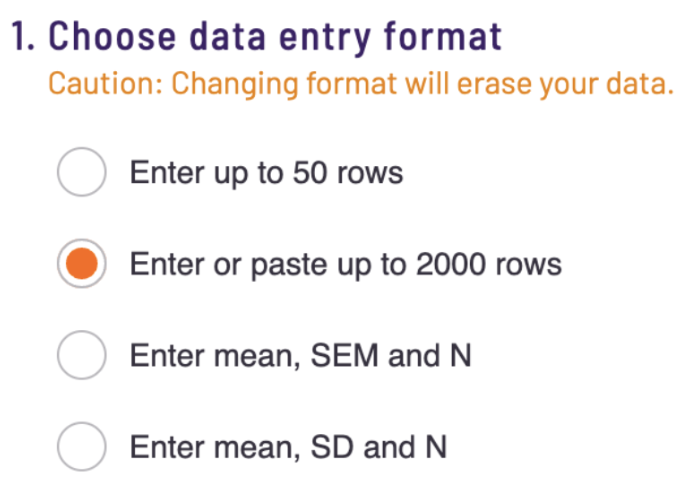
Step 7. Select "Copy and paste up to 2000 rows" function.
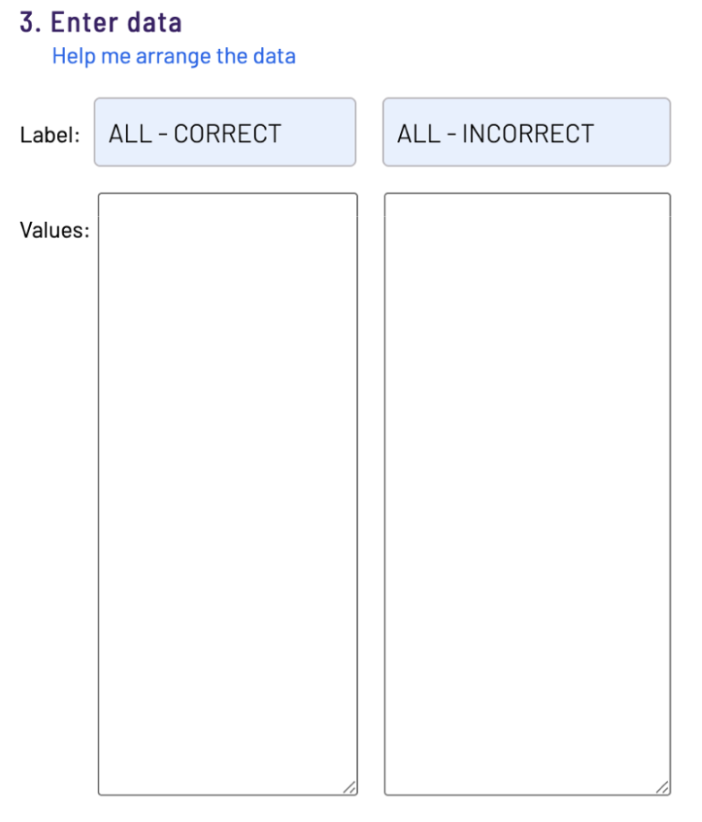
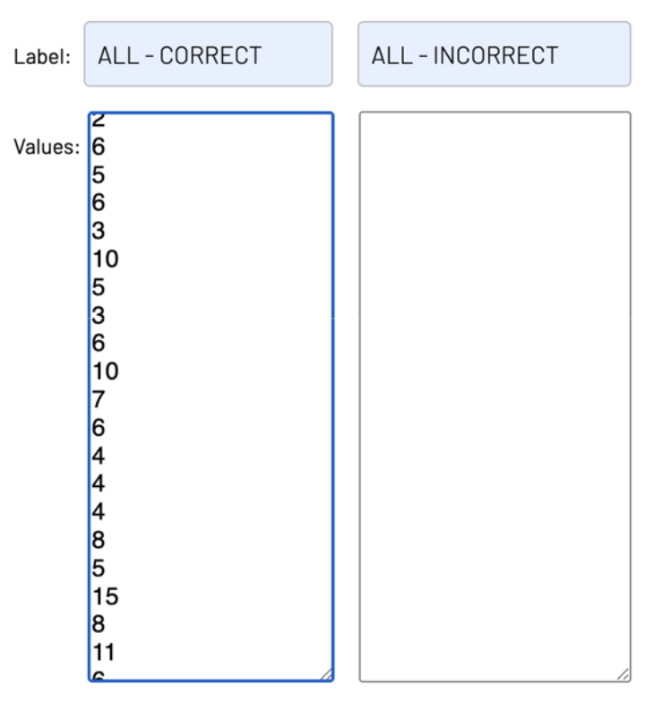
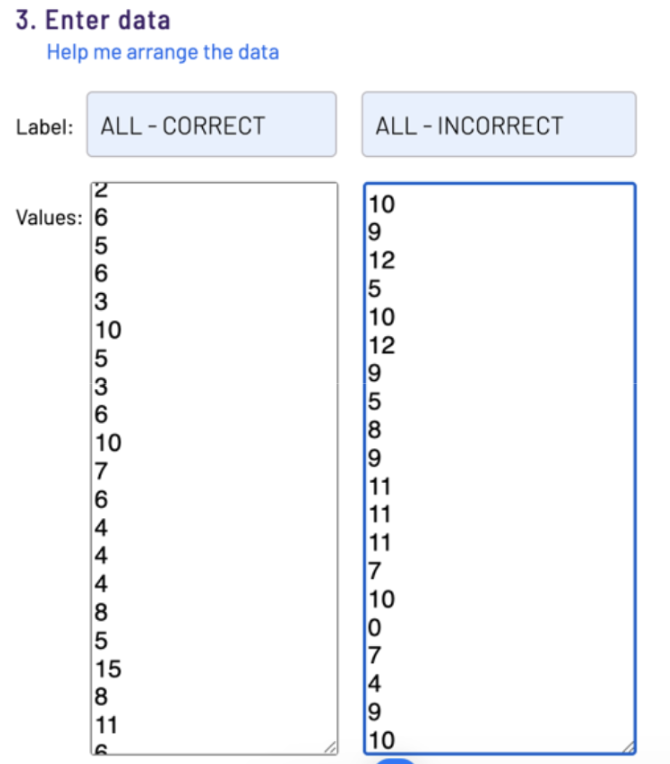
Step 8. Label Group 1 (ALL - CORRECT) and Group 2 (ALL - INCORRECT)
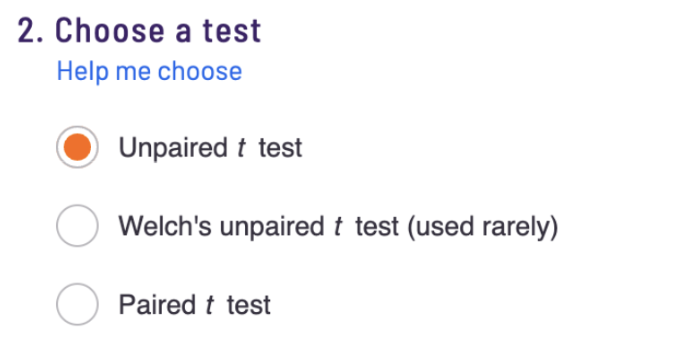
Step 9. Select unpaired t-test
Step 10. Access the Skittles Datasheet
Modules > Scientific Method > Skittles Datasheet
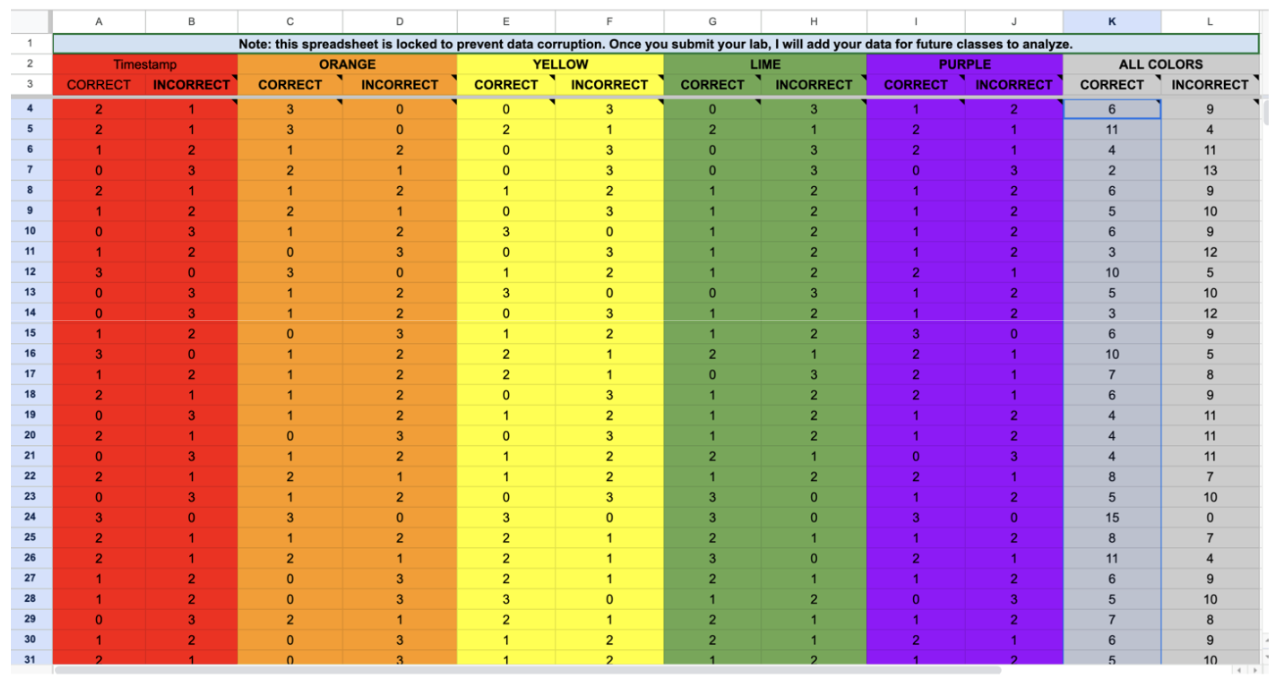
Note: This spreadsheet is locked to prevent data corruption. I will add your data to it once you submit it.

Step 11a. Copy ALL COLORS - CORRECT (in grey)
Step 11b. Paste the Data into the ALL - CORRECT Column in t-test.
Step 11c. Copy the ALL COLORS - INCORRECT data.
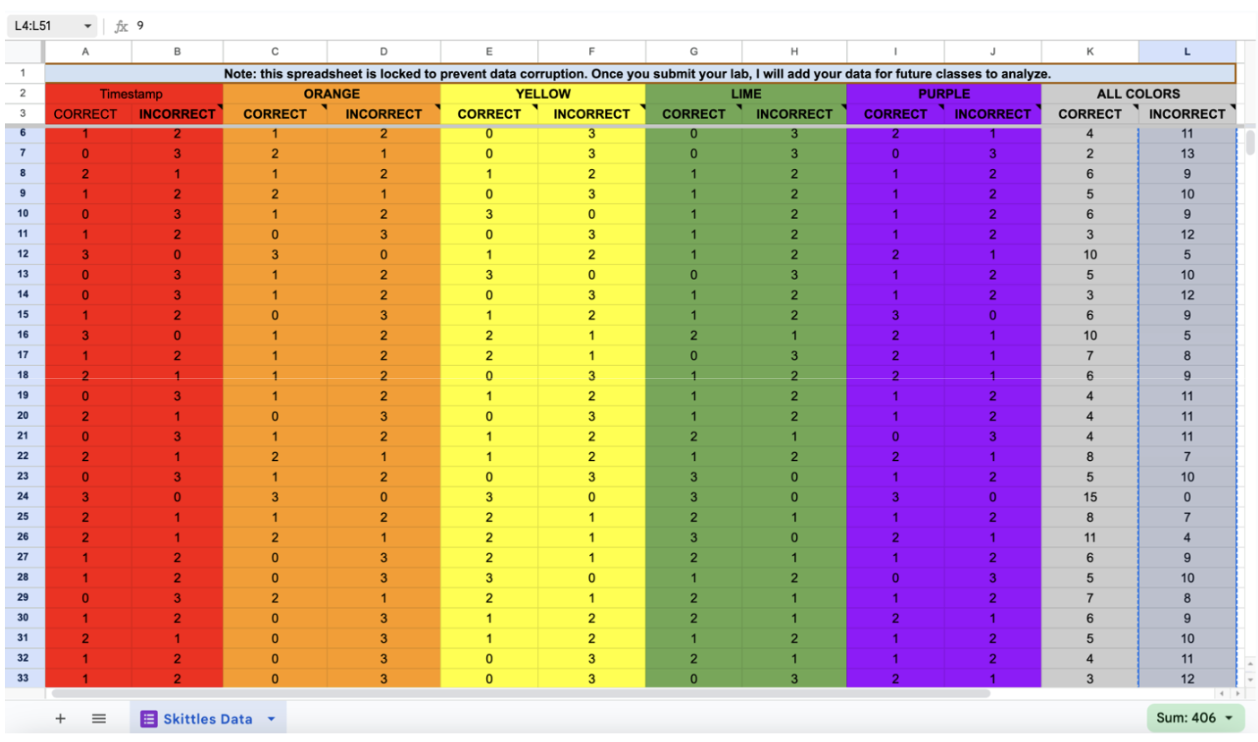
Step 11d. Paste the ALL - INCORRECT data into the t-test
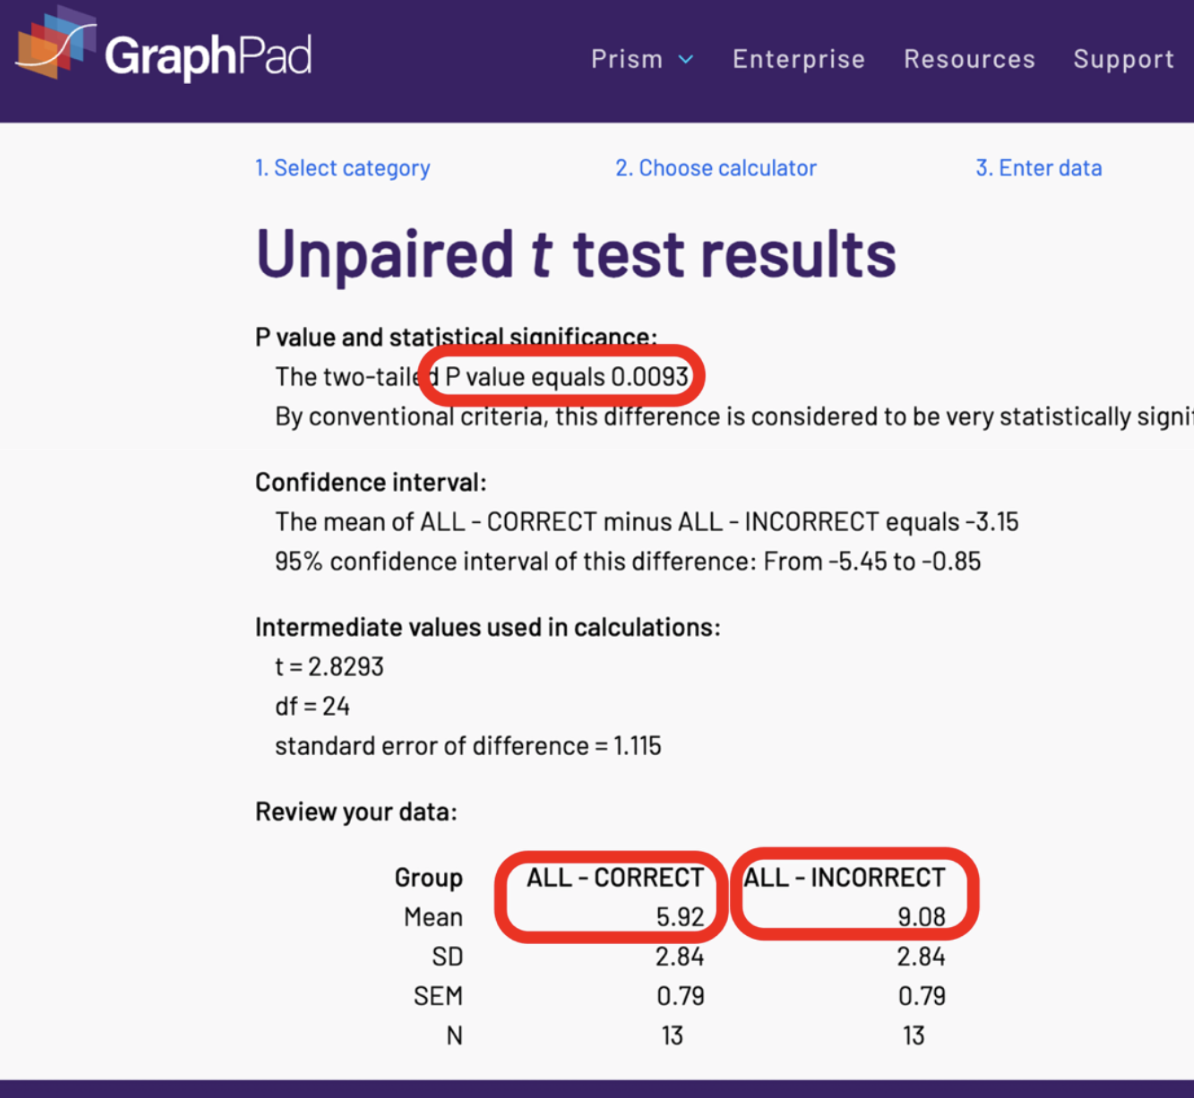
Step 11d. Press Calculate Now.
Make sure your screen looks like this. The numbers may be a bit different. Check the first number on each. If it adds up to 15, it is correct.

Step 12. Record your results
Record the p-value and means from your own t-test results. Do not copy the example screenshot values—using them will result in no credit for the analysis and conclusion sections. You do not need to screenshot your t-test results. I will know if you did them correctly or not.
Step 13. Graph your p-value and means on your analysis page.
Be sure to complete all the tasks in the rounded box (p-value, means, and numbers on the y-axis).
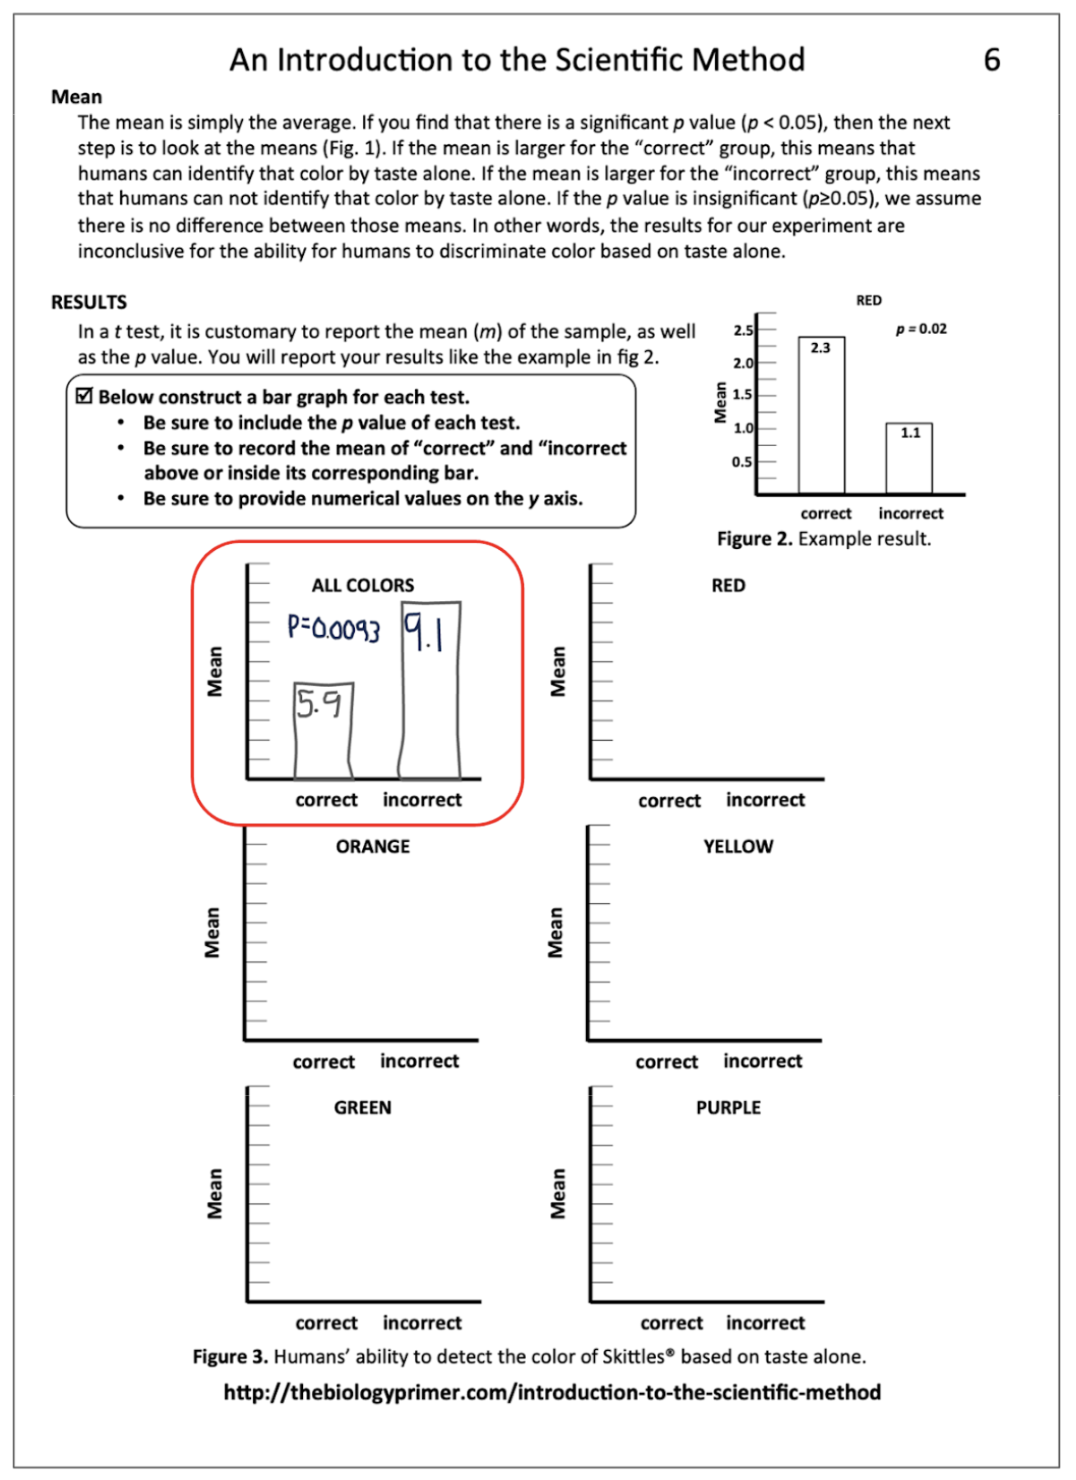
Step 14. Repeat the t-test for each individual color (red, orange, yellow, green, and purple) to complete the analysis.
You do not need to attach screenshots of the t-test results.
Step 15. Complete your conclusions and get ready to submit.
Step 16. Make a PDF
Combine your lab and your experimental setup photo into a single PDF.
For help: Modules > Start Here > Submitting Your Lab
Step 17. Lab Submission
Modules > Scientific Method > Lab Submission: Scientific Method

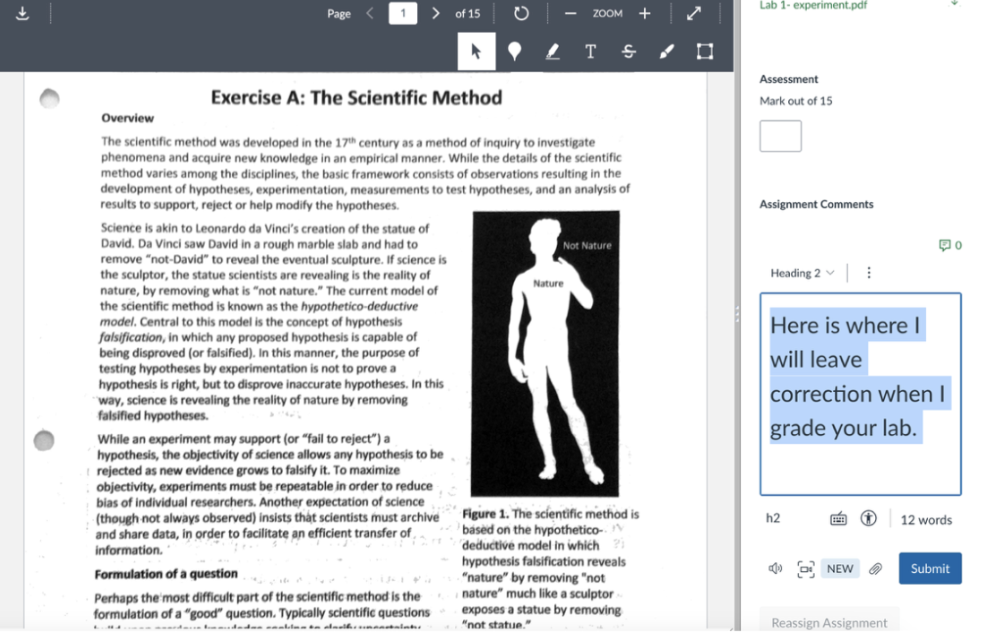
Labs are always due on Friday at 5pm. I grade them the following week and leave feedback in the Canvas submission comments. Please review that once you receive your grade. It will look like this.
Need Help?
If you have any (and I mean any) questions about the content of this class or clarification about the expectations of the class, please Canvas Inbox me as much as you need to.